
The May state of the network report continues to depict the evolving dynamics within the Swarm network, reflecting adjustments and shifts in various metrics. This analysis highlights significant trends and changes observed throughout the month, providing insights into the performance and activity within the network.
Network Total Monthly Rewards
This metric shows the total rewards paid out across the entire network for each month.
| Month | Total Network Rewards (xBZZ) |
|---|---|
| December | 159,865 |
| January | 157,596 |
| February | 152,974 |
| March | 104,657 |
| April | 76,024 |
| May | 109,209 |
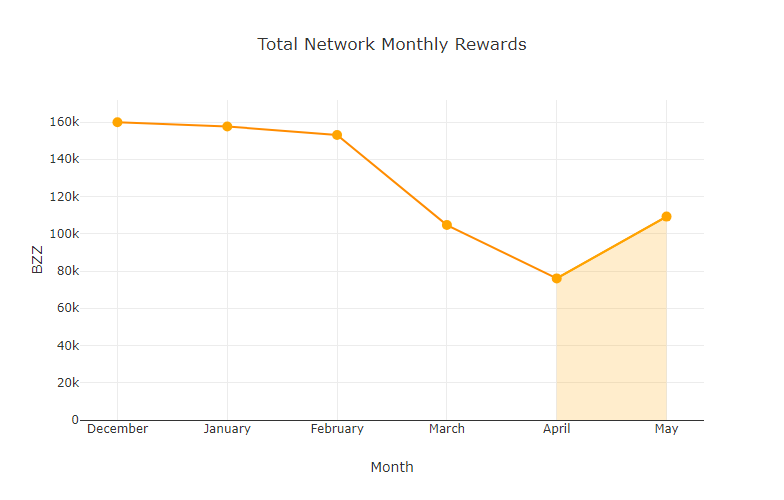
In May, the total network rewards saw a notable increase to 109,209 xBZZ, reversing the declining trend from the previous months.
Monthly Median Win Values
This metric is the median win amount for each win event.
| Month | Median Win Values (xBZZ) |
|---|---|
| December | 48.06 |
| January | 47.43 |
| February | 49.15 |
| March | 27.43 |
| April | 22.27 |
| May | 32.65 |
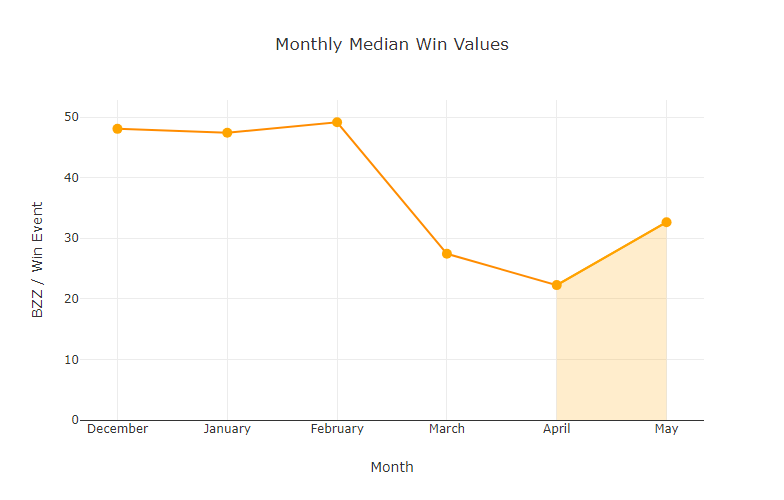
The median win value increased to 32.65 xBZZ in May, indicating an increase from the sharp decline observed in April.
Monthly Average Win Values
This metric is the average win amount for each win event.
| Month | Average Win Values (xBZZ) |
|---|---|
| December | 57.75 |
| January | 51.20 |
| February | 54.42 |
| March | 34.96 |
| April | 25.43 |
| May | 36.56 |
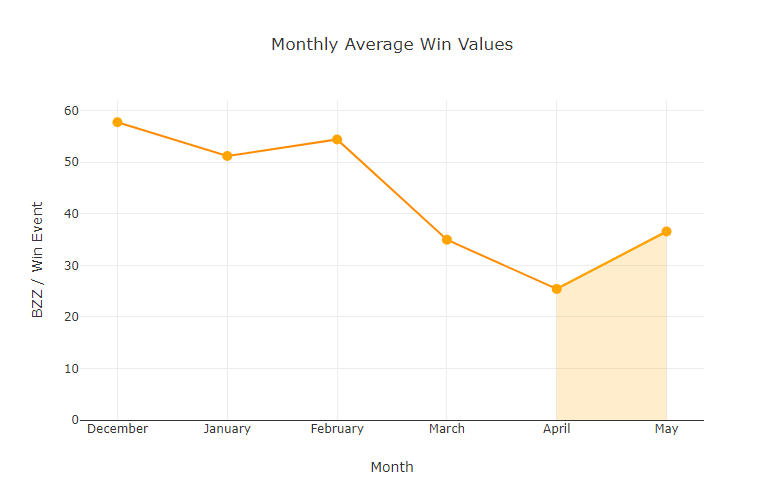
In May, the average win value increased to 36.56 xBZZ, increasing from the lower values in the previous two months.
Active Staking Node Monthly Average Earnings
This metric shows the average monthly earnings for an active staking node (with an “active node” defined as a node which has submitted a commit transaction at least once in the month).
| Month | Avg Total Earnings per Node (xBZZ) |
|---|---|
| December | 12.40 |
| January | 13.89 |
| February | 13.21 |
| March | 7.71 |
| April | 5.64 |
| May | 10.66 |
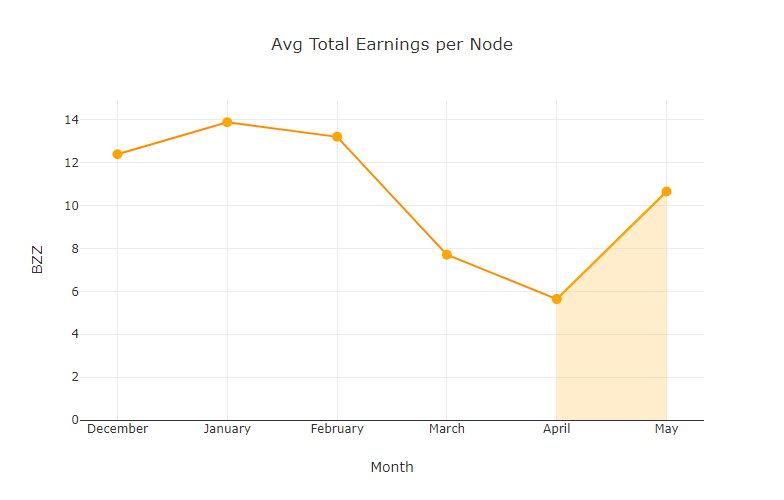
The average earnings per active staking node rose to 10.66 xBZZ in May, indicating an increase in average earnings from March and April.
Total Active Staking Nodes by Month
This metric shows the total active staking nodes by month.
| Month | Total Active Staking Nodes |
|---|---|
| December | 12,891 |
| January | 11,350 |
| February | 11,576 |
| March | 13,571 |
| April | 13,486 |
| May | 10,245 |
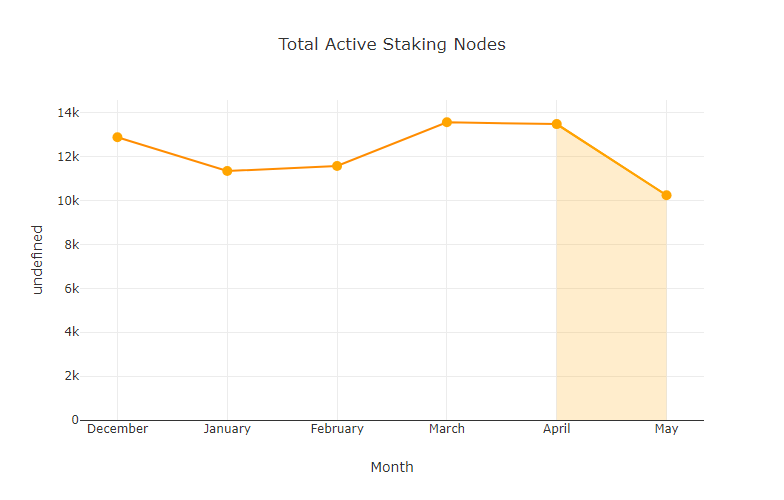
In May, the total number of active staking nodes (nodes with at least one commit in the month) decreased to 10,198.
Total Reachable Full Nodes Regardless of Active Status
In this new reporting category, we record the total number of unique reachable full nodes, regardless of whether or not they have issued a commit transaction within the month. In May there were 16,000 unique full nodes which were reachable at least once throughout the month.
Total Winning Nodes by Month
This metric shows the total number of unique active staking nodes which have won at least once within the month.
| Month | Total Winning Nodes |
|---|---|
| December | 2,308 |
| January | 2,474 |
| February | 2,814 |
| March | 2,413 |
| April | 2,486 |
| May | 2,554 |
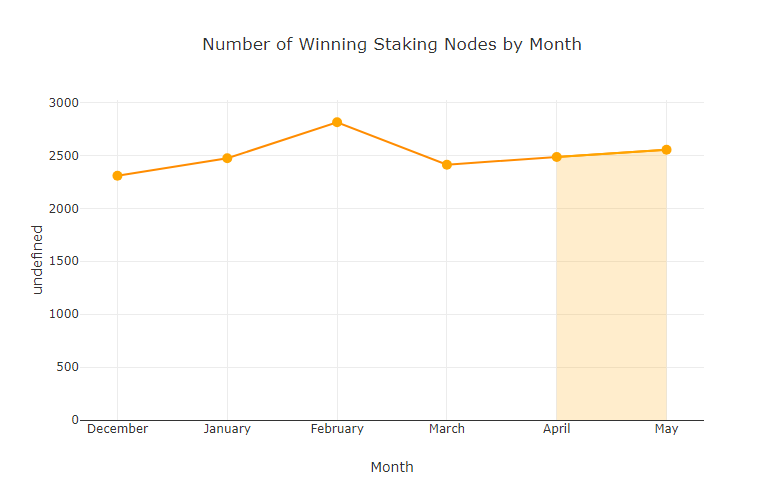
The number of winning nodes increased to 2,554 in May, marking a steady rise from the previous month.
Total Active Staking Nodes by Country
This metric shows the total number of active staking nodes across the top four countries and all other countries aggregated into the “Other” category, as well as the remaining nodes in the “Unknown” category.
| China | Germany | Finland | Unknown | United States | Other | |
|---|---|---|---|---|---|---|
| December | 8,333 | 2,001 | 1,919 | 265 | 312 | 61 |
| January | 6,696 | 1,937 | 1,769 | 701 | 181 | 66 |
| February | 6,787 | 1,958 | 1,952 | 688 | 116 | 75 |
| March | 7,785 | 1,953 | 2,232 | 1,408 | 91 | 102 |
| April | 7,249 | 1,912 | 2,291 | 1,851 | 92 | 91 |
| May | 6,014 | 1,671 | 2,075 | 339 | 83 | 63 |
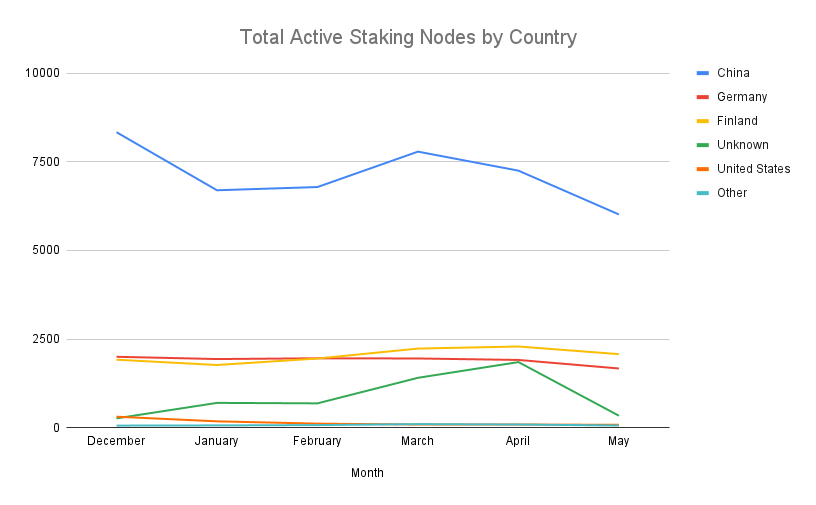
In May, the number of active staking nodes declined across all categories.
In previous months there was an unintentional overcount of active nodes, primarily in the number of Unknown nodes. Its correction in this month is what accounts for the apparent large decline in Unknown nodes.
Conclusion
The data from May highlights significant shifts and adaptations within the Swarm network. While the total number of active staking nodes has decreased, this reduction along with an increase in total network monthly rewards has led to an increase in average earnings per node. The uptick in total network rewards and average win values suggests a positive trend, indicating robust activity and engagement. These changes underscore the dynamic nature of the Swarm network, showcasing its ability to adapt and sustain profitability for active nodes despite fluctuations in participation.
Discussions about Swarm can be found on Reddit.
All tech support and other channels have moved to Discord!
Please feel free to reach out via info@ethswarm.org
Join the newsletter! .